| Friday, 07/18/2025 | ||
| Friday, 07/18/2025 | ||

| Current meteorological data | |
| Air temperature: | 66.38 (°F) |
| 19.1 (°C) | |
| Wind speed: | 3 (km/h) |
| Wind direction: | S, 186.5 ° |
| Global radiation: | -- (W/m²) |
| Act. UV-Index: | -- |
| Precipitation: | 0.0 (ltr/m²) |
| (Updated: 07/18/2025, 01:30, S-Mitte, Amt für Umweltschutz |
|
| More meteorological data | |
| More about weather Stuttgart |
|
| Current sun location |
|
| Webcams in Stuttgart |
|
Weather forecast Stuttgart  |
|
| Weather forecast Europe |
|
| Weather radar Germany |
|
| More links | |
| News and current events |
|
| Heat Action Plan of the State Capital Stuttgart 2025 | |
| Heat Action Plan Stuttgart 2025 | |
| Climate Change Adaptation Concept Stuttgart (KLIMAKS) | |
| (KLIMAKS) Progress Report 2025 | |
| Climate Center Stuttgart | |
| Climate Dashboard Stuttgart | |
| Summer Days and Hot Days in Stuttgart (until 2025) | |
| Air: Press releases (German) | |
| UV-Index Prognosis (BfS) | |
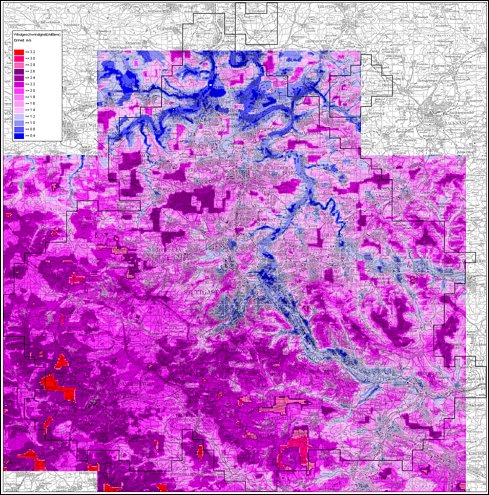
| Urban climate Viewer: Maps and plans with detailed thematic maps on climate, air and noise | |
| Noise Maps Stuttgart 2022 | |
| Noise action plan Stuttgart | |
| Clean air plan Stuttgart | |
| NO2 and PM10 exceedances | |
| Current measurements from the stations (LUBW) | |
| Picture gallery More news | |
 |
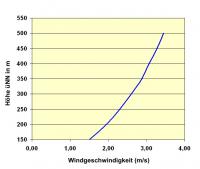 | |
Fig. 8.1: Average wind speed depending on the altitude | |
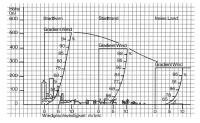 | |
Fig. 8.2: Vertical wind profile above the inner city, the outskirts and open land (SINGER and SMITH, 1970). | |

| |
|
| © City of Stuttgart, Office for Environmental Protection, Section of Urban Climatology | |

