4. Synoptic map (map-I)
 Download of map-I
 (as a PDF file)
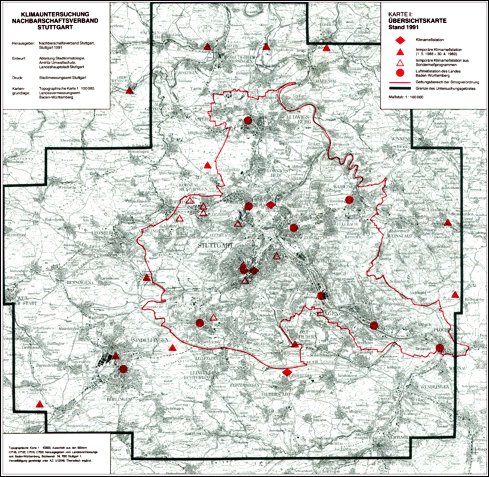
The synoptic map shows Greater Stuttgart and the territory of the neighbourhood association Stuttgart.
The following towns and cities and municipalities are associated in the neighbourhood association Stuttgart:
| Sector Committee of Böblingen |
Sector Committee of Esslingen |
| Böblingen |
Aichwald |
| Magstadt |
Denkendorf |
| Schönaich |
Esslingen a.N. |
| Sindelfingen |
Neuhausen a.d.F. |
| |
Ostfildern |
| |
|
| Sector Committee of Leonberg |
Sector Committee of Ludwigsburg |
| Leonberg |
Asperg |
| Renningen |
Kornwestheim |
| Rutesheim |
Ludwigsburg |
| |
Möglingen |
| |
Remseck a.N. |
| |
|
| Sector Committee of Stuttgart |
Sector Committee of Waiblingen/ |
| Ditzingen |
Fellbach |
| Gerlingen |
Fellbach |
| Korntal-Münchingen |
Kernen i.R. |
| Filderstadt |
Korb |
| Leinfelden-Echterdingen |
Waiblingen |
| Stuttgart |
Weinstadt |
The area under investigation is bordered in grey on the map. It comprises parts of the regional association of the middle Neckar region and is about 1,000 km² wide.
The area encircled by a red line is the scope of the Smog Ordinance (according to the Smog Ordinance of the Land of Baden-Württemberg from 27 June 1988).
Red points on the map indicate the locations of the individual air measuring stations of the Land of Baden-Württemberg, which are supervised by the UMEG (Zentrum für Umweltmessungen, Umwelterhebungen und Gerätesicherheit, a centre for environmental measurements and statistics) in Karlsruhe. What is usually measured at these stations is the pollutant components sulphur dioxide, carbon monoxide, nitrogen monoxide, nitrogen dioxide, ozone and dust, but also the meteorological parameters wind speed, wind direction, air temperature, air humidity and solar radiation.
Red rhombic marks represent the locations of measuring stations. But this investigation required 12 additional stations for the measurement of wind direction, wind speed, air temperature and air humidity. The temporary stations are represented by red triangles on the map.
Only temperature and humidity was measured at the two temporary measuring stations Böblingen/Leinfelden and Baldtmannsweiler as they were located on the edge of little clearings where wind measurements made no sense.
| |

|
 |
|
| © City of Stuttgart, Office for Environmental Protection, Section of Urban Climatology |