| Friday, 07/31/2026 | ||
| Friday, 07/31/2026 | ||

| Current meteorological data | |
| Air temperature: | 86.36 (°F) |
| 30.2 (°C) | |
| Wind speed: | 5 (km/h) |
| Wind direction: | N-N-W, 337.8 ° |
| Global radiation: | -- (W/m²) |
| Act. UV-Index: | -- |
| Precipitation: | 0.0 (ltr/m²) |
| (Updated: 07/31/2026, 11:30, S-Mitte, Amt für Umweltschutz |
|
| More meteorological data | |
| More about weather Stuttgart |
|
| Current sun location |
|
| Webcams in Stuttgart |
|
Weather forecast Stuttgart  |
|
| Weather forecast Europe |
|
| Weather radar Germany |
|
| More links | |
| News and current events |
|
| Current fine dust values (LUBW station Hauptstätter StraÃe) (German) | |
| Current Grafics | |
| Current number of summer days and hot days in Stuttgart 2026 | |
| Current graphics | |
| Climate Center Stuttgart | |
| Climate Dashboard Stuttgart | |
| Summer Days and Hot Days in Stuttgart (until 2026) | |
| UV-Index Prognosis (BfS) | |
| Urban climate Viewer: Maps and plans with detailed thematic maps on climate, air and noise | |
| Noise Maps Stuttgart 2022 | |
| Noise action plan Stuttgart | |
| Clean air plan Stuttgart | |
| NO2 and PM10 exceedances | |
| Current measurements from the stations (LUBW) | |
| Picture gallery More news | |
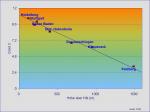 | |
Fig. 3.1: Average annual air temperature of locations at different altitudes in Baden-Württemberg (source: German Meteorological Service) | |
| Average temperature in January | 32 °F/0 °C |
| Average temperature in April | 48.2 °F/9 °C |
| Average temperature in July | 64.4 °F/18 °C |
| Average temperature in October | 48.2 °F/9 °C |
| Annual average | 48.2 °F/9 °C |
| Average annual fluctuation | 64.4 °F/18 °C |
| Frost days per year | 80 |
| Ice days per year | 20 |
| Daily average in °F/°C |
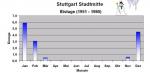
average amount of ice days |
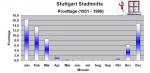
average amount of frost days |
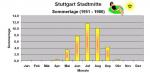
amount of summer days |
|
| January | 31.3/-0,4 | 8 | 22 | 0 |
| February | 33.8/1.0 | 5 | 18 | 0 |
| March | 40.1/4.5 | 1 | 13 | 0 |
| April | 46.9/8.3 | 0 | 5 | 0 |
| May | 54.9/12.7 | 0 | 1 | 2 |
| June | 60.8/16.0 | 0 | 0 | 6 |
| July | 63.9/17.7 | 0 | 0 | 9 |
| August | 62.6/17.0 | 0 | 0 | 8 |
| September | 57.4/14.1 | 0 | 0 | 3 |
| October | 48.6/9.2 | 0 | 3 | 0 |
| November | 39.4/4.1 | 1 | 12 | 0 |
| December | 33.4/0.8 | 7 | 22 | 0 |
| Year |
47.7/8.7 |
22 |
93 |
30 |
| Daily average in °F/°C |
average amount of ice days |
average amount of frost days |
amount of summer days |
|
| January | 34.3/1.3 | 6 | 16 | 0 |
| February | 36.3/2.4 | 3 | 13 | 0 |
| March | 42.3/5.7 | 1 | 9 | 0 |
| April | 49.1/9.5 | 0 | 2 | 1 |
| May | 56.7/13.7 | 0 | 0 | 3 |
| June | 62.8/17.1 | 0 | 0 | 8 |
| July | 65.8/18.8 | 0 | 0 | 12 |
| August | 64.6/18.1 | 0 | 0 | 10 |
| September | 59.0/15.0 | 0 | 0 | 4 |
| October | 50.4/10.2 | 0 | 1 | 0 |
| November | 41.7/5.4 | 1 | 6 | 0 |
| December | 36.1/2.3 | 4 | 15 | 0 |
| Year |
50.0/10.0 |
15 |
62 |
39 |
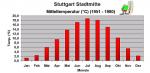 |  |  |
Average temperature |
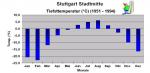
Minimum temperature |
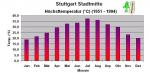
Maximum temperature |
 |  |  |
Ice days |
Frost days |
Summer days |
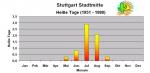 |  |  |
Hot days |
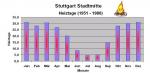
Heating days |
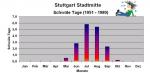
Sultry days |

| |
|
| © City of Stuttgart, Office for Environmental Protection, Section of Urban Climatology | |

