| Mittwoch, 02.07.2025 | ||
| Mittwoch, 02.07.2025 | ||

| Aktuelle Wetterdaten | |
| Lufttemperatur: | 24.3 (°C) |
| Windgeschw.: | 4 (km/h) |
| Windrichtung: | N-N-W, 342.2 ° |
| Globalstrahlung: | -- (W/m²) |
| Akt. UV-Index: | -- |
| Niederschlag: | 0.0 (ltr/m²) |
| (Stand: 02.07.2025, 08:30 Uhr, S-Mitte, Amt für Umweltschutz) |
|
| Weitere Luft- u. Wetterdaten | |
| Mehr zum Wetter in Stuttgart |
|
| Aktueller Sonnenstand |
|
| Webcams in Stuttgart |
|
Vorhersage Region Stuttgart  |
|
| Vorhersage Europa |
|
| Niederschlagsradar Baden-W. |
|
| Weitere Links | |
| Neues und Aktuelles |
|
| Klimawandel-Anpassungskonzept Stuttgart Fortschrittsbericht 2025 | |
| KLIMAKS Fortschrittsbericht 2025 | |
| Luftbilanz Stuttgart 2022 - 2024: Neuer Bericht zum downloaden | |
| Luftbilanz Stuttgart | |
| Klimazentrale Stuttgart | |
| Klima Dashboard Stuttgart | |
| Sommertage und Heiße Tage in Stuttgart (bis 2025) | |
| Luft: Neue Pressemitteilungen | |
| UV-Index Prognose der BfS | |
| Stadtklimaviewer: Karten und Pläne mit detaillierten Themen- karten zu Klima, Luft und Lärm | |
| Lärmkarten Stuttgart 2022 | |
| Lärmaktionsplan Stuttgart | |
| Luftreinhalteplan Stuttgart | |
| NO2- und PM10 Überschreitungen | |
| Aktuelle Messwerte an den Messstationen der LUBW | |
| Bildergalerie Weitere News | |
| Mess- station |
1 |
2 |
3 |
4 |
5 |
6 |
7 |
8 |
| Betreiber |
Stadt
Stuttgart |
LUBW
|
LUBW
|
LUBW
|
LUBW
|
LUBW
|
LUBW
|
LUBW
|
| 2002 |
0
|
0
|
0
|
2
|
-
|
-
|
-
|
-
|
| 2003 |
0
|
0
|
2
|
21
|
-
|
-
|
-
|
-
|
| 2004 |
0
|
5
|
0
|
5
|
5
|
293
|
143
|
555
|
| 2005 |
0
|
0
|
0
|
4
|
-
|
250
|
175
|
848
|
| 2006 |
0
|
0
|
3
|
43
|
-
|
160
|
548
|
853
|
| 2007 |
0
|
0
|
0
|
8
|
-
|
123
|
289
|
450
|
| 2008 |
0
|
0
|
0
|
9
|
-
|
Messung
eingestellt |
300
|
377
|
| 2009 |
0
|
0
|
0
|
22
|
-
|
-
|
629
|
499
|
| 2010 |
0 | 0 | 0 | 6 | - | - | 379 | 182 |
| 2011 |
0
|
0
|
1
|
6
|
-
|
-
|
269
|
76
|
| 2012 |
0
|
0
|
Messung
eingestellt |
2
|
-
|
-
|
196
|
69
|
| 2013 |
0
|
0
|
-
|
4
|
-
|
-
|
21
|
63
|
| 2014 |
0
|
0
|
-
|
0
|
-
|
-
|
16
|
36
|
| 2015 |
0
|
0
|
-
|
0
|
-
|
-
|
15
|
61
|
| 2016 |
0
|
0
|
-
|
0
|
-
|
-
|
10
|
35
|
| 2017 |
0
|
0
|
-
|
0
|
-
|
-
|
3
|
3
|
| 2018 |
0
|
0
|
-
|
0
|
-
|
-
|
0
|
11
|
| 2019 |
0
|
0
|
-
|
0
|
-
|
-
|
3
|
2
|
| 2020 | 0 | 0 | - | 0 | - | - | 0 | 0 |
| 2021 | 0 | 0 | - | 0 | - | - | 0 | 0 |
| 2022 | 0 | 0 | - | 0 | - | - | 0 | 0 |
| 2023 | 0 | 0 | - | 0 | - | - | 0 | 0 |
| 2024 |
0
|
0
|
-
|
0
|
-
|
-
|
0
|
0
|
| 2025 bis 31.05. |
0
|
0
|
-
|
0
|
-
|
-
|
0
|
0
|
|
.
|
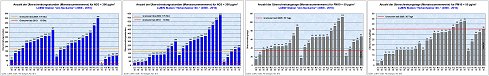
| 1:
S-Mitte, Eberhardstr. (Schwabenz. bis 2019) 1: S-Mitte, Gaisburgstr. (AfU ab 2020) |
5: S-Bad Cannstatt: Waiblinger Str. |
| 2: S-Bad Cannstatt, Seubertstr. | 6: S-Feuerbach, Siemensstr. |
| 3: S-Zuffenhausen, Frankenstr. | 7: S-Mitte, Hohenheimer Str. |
| 4: S-Mitte StraÃe, Arnulf-Klett-Platz | 8: S-Mitte, Am Neckartor |
| Mess- station |
1 |
2 |
3 |
4 |
5 |
6 |
7 |
8 |
| Betreiber |
Stadt
Stuttgart |
LUBW
|
LUBW
|
LUBW
|
LUBW
|
LUBW
|
LUBW
|
LUBW
|
| 2002 |
15
|
23
|
32
|
52
|
-
|
-
|
-
|
-
|
| 2003 |
19
|
23
|
40
|
60
|
-
|
-
|
-
|
-
|
| 2004 |
7
|
14
|
29
|
42
|
65
|
63
|
58
|
160
|
| 2005 |
7
|
12
|
26
|
37
|
-
|
51
|
62
|
187
|
| 2006 |
21
|
29
|
34
|
47
|
76
|
81
|
84
|
175
|
| 2007 |
6
|
16
|
21
|
32
|
40
|
60
|
52
|
110
|
| 2008 |
8
|
11
|
12
|
14
|
33
|
Messung
eingestellt |
21
|
89
|
| 2009 | 10 | 14 | 15 | 23 | 38 | - | 43 | 112 |
| 2010 |
6
|
14
|
19
|
40
|
39
|
-
|
43
|
102(104)
|
| 2011 |
2
|
11
|
13
|
42
|
54
|
-
|
38
|
89
|
| 2012 |
5
|
7
|
Mess.
ein- gestellt |
15
|
31
|
-
|
29
|
78
|
| 2013 |
1
|
10
|
-
|
26(27)
|
32(34)
|
-
|
27
|
87(91)
|
| 2014 |
0
|
7(8)
|
-
|
16(19)
|
12
|
-
|
15
|
62(64)
|
| 2015 |
3
|
3
|
-
|
17
|
3
|
-
|
24
|
68(72)
|
| 2016 |
2
|
5
|
-
|
19(20)
|
5
|
-
|
13(14)
|
58(63)
|
| 2017 |
5
|
11
|
-
|
17
|
11
|
-
|
16
|
41(45)
|
| 2018 |
3
|
3
|
-
|
7
|
11
|
-
|
11
|
20(21)
|
| 2019 |
0
|
3
|
-
|
6
|
-
|
-
|
5
|
25(27)
|
| 2020 | 2 |
2 |
- | 8 |
- | - | 3 |
15(17) |
| 2021 |
3
|
3
|
-
|
5
|
-
|
-
|
5
|
11
|
| 2022 | 0 |
0
|
- |
0
|
- | - | 4 | 2 |
| 2023 |
2
|
2
|
-
|
2
|
-
|
-
|
3
|
3
|
| 2024 | 4 bis 31.12. |
4
bis 28.11. |
- |
4
bis 28.11. |
- | - |
4
bis 28.11. |
7
bis 28.11. |
| 2025 | 2 bis 31.05. |
2
bis 28.04. |
- |
5
bis 28.04. |
- | - |
4
bis 28.04. |
6
bis 28.04. |
| 1:
S-Mitte, Eberhardstr. (Schwabenz. bis 2019) 1: S-Mitte, Gaisburgstr. (AfU ab 2020) |
5: S-Bad Cannstatt: Waiblinger Str. |
| 2: S-Bad Cannstatt, Seubertstr. | 6: S-Feuerbach, Siemensstr. |
| 3: S-Zuffenhausen, Frankenstr. | 7: S-Mitte, Hohenheimer Str. |
| 4: S-Mitte StraÃe, Arnulf-Klett-Platz | 8: S-Mitte, Am Neckartor |

| |
|
| © Landeshauptstadt Stuttgart, Amt für Umweltschutz, Abt. Stadtklimatologie | |

