4. Thermal situation 4.2 Bioclimate4.2.1 Days with heat stress
|  |
|
|
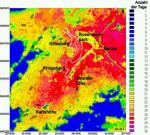
Fig. 4-5: Average annual amount of days with heat stress in Stuttgart
|
A person's heat balance is their closest link to the atmospheric conditions. These conditions range from the meteorological elements air temperature, humidity and wind speed to short and long wave radiation with thermophysiological effects on people. Their significance for health is connected with the cross-linking of thermal and circulatory regulation.
People can adapt to the change of seasons accompanied by a change in the thermal conditions by the choice of their clothing. They can so obtain thermal comfort for most days of the year. When certain levels are exceeded, we speak of heat stress (despite summer clothes) and cold stress (despite winter clothes). The mechanisms of our organism's thermal regulation are increasingly exercised. This is reflected in a modified circulation with intensified sweating in case of warm temperatures and a higher metabolic rate with shivering in case of cold temperatures, both signs for a cardiovascular and respiratory strain. While the obstruction of heat release is always perceived as stress, the perception is ambivalent for coldness. It can be both stress and a desired stimulus that trains the adaptability of the organism.
 | |
|
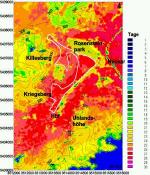
Fig. 4-6: Average annual amount of days with heat stress in the plan area for Stuttgart 21
| |
Figure 4-5 represents the average annual days with heat stress in Stuttgart. Figure 4-6 shows the enlarged part of the first picture with the plan area for Stuttgart 21 and its proximity. The amount of days with heat stress varies significantly from one area to the other: While Stuttgart's centre in the city basin and the city districts in the Neckar valley have up to more than 30 days with heat stress during the year, the surroundings and especially the Filder region, often in built-up areas, have less than 20 days with heat stress, forested areas even under 10 days (JENDRITZKY, 1995). The plan area for Stuttgart 21 has currently about 30 days with heat stress during the year. You can see the positive influence of open spaces and parks in the fact that the adjacent Rosensteinpark, the castle gardens and the Pragfriedhof cemetery have no more than 22 days with heat stress during the year.
4.2.2 Local models
 | |
|
Fig. 4.7: Model in the wind tunnel
| |
A land-use plan for the southern subarea of the plan area was developed on the basis of the city planing for Stuttgart 21. Microclimatic models on wind comfort, aeration, air hygiene, bioclimatic and shading conditions around the plan area and the adjacent built-up areas were realised for subarea A north of the central station (BLAZEK et al., 1998), which is confined by Heilbronner StraÃe, WolframstraÃe, the castle gardens and the railway territory. Models were realised in particular for the central station, which is to be modified.
As the air flow conditions are very complex, some of the local analyses were conducted in the wind tunnel (fig. 4-7). The city planning's effects for air hygiene were studied with MISKAM, a microscale flow and dispersion model. On the basis of the results achieved with the help of the wind tunnel models, the parameters required for MISKAM could be optimised.
Figures 4-8 and 4-9 are examples of the MISKAM results for the pollutant calculations around the central station. Figure 4-8 represents the current state, figure 4-9 the predicted state for the year 2010.
The current picture shows a relatively high benzene concentration around the central station. The inspection value of the 23rd Federal Immission Control Ordinance (10 µg benzene per m³) is clearly exceeded at a building on the east side of FriedrichstraÃe. The predicted concentration for 2010 indicates a significantly lower level of immisions. The highest concentration of benzene at the built-up area near Heilbronner StraÃe is about 4.5 µg/m³. This is the result of less traffic and fewer exhaust fumes emitted by vehicles.
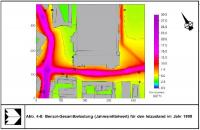 | | 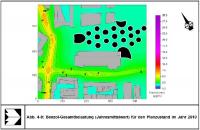 |
Fig. 4-8: Total amount of benzene (annual average) for the current state of 1995
|
|
Fig. 4-9: Total amount of benzene (annual average) for the predicted state of 2010
|
|
| |

|
 |
|
| © City of Stuttgart, Office for Environmental Protection, Section of Urban Climatology |