7. Immissions 7.1 Extensive air pollution
The data on the ambient air concentration of air pollutants, which was collected for the whole of Stuttgart, dates from 1985/86. The situation has considerably changed as for some pollutants thanks to numerous air pollution control measures and the mentioned data can no longer be considered as representative. This is why the state of Baden-Württemberg has induced the updating of the immission inventory, but first results are not to be expected before 1997.
In order to be able to provide information on the basic pollution of the plan area for Stuttgart 21, we resort to the measuring stations Stuttgart-Zentrum and Stuttgart-Bad Cannstatt (within the regional measuring network) and the Schwabenzentrum measuring station (run by the Office for Environmental Protection). Average air pollution values can be indicated approximately for the plan area for Stuttgart 21 by averaging the concentrations measured at these stations in 1995. These values are listed in table 7-1. I1 means the average annual concentration, I2 the measure of the average peak concentration as a 98 percentile. The table also includes the environmental quality targets for the air concluded by Stuttgart's city council (the target year for the comprehensive adherence to the target values is 1997; target value 2).
Table 7-1 shows that the target values 2 for the major pollutants were adhered to in the plan area concerning the average concentration as well as the average short-term peak values. The only value that just exceeds the target value of 120 µg/m³ is the I2 value for ozone.
| Pollutant |
I1 |
I2 |
Comprehensive target value I1 |
Comprehensive target value I2 |
| NO2 |
39 |
80 |
50 |
135 |
| SO2 |
7 |
27 |
50 |
120 |
| CO |
1000 |
3000 |
3000 |
10000 |
| O3 |
33 |
130 |
40 |
120 |
| Staub |
27 |
80 |
50 |
100 |
Table 7-1: Basic concentration of pollutants in the plan area
for Stuttgart 21 Values in µg/m³
|
|  |
|
|
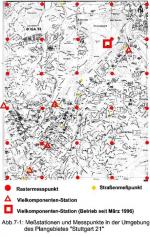
Fig. 7-1: Measuring stations and measuring points around the plan area for Stuttgart 21
|
In order to receive more detailed and more representative data on the pollution and air exchange in the plan area, a poly component measuring station was established by the Institute of Process Engineering and Power Plant Technology (Institut für Verfahrenstechnik und Dampfkesselwesen, IVD) at the end of the railway tracks near the railway parcel post office at EhmannstraÃe, which is to be operated for one year. The results will be available in the first half of 1997. Figure 7-1 shows the existing air measuring stations, the road measuring points (Office for Environmental Protection) as well as the raster measuring points (current updating of the immission inventory) for the analysis of the ambient air concentration around the plan area for Stuttgart 21.
After the updating of the immission inventory, data on the following pollutants will be available in the form of a 1-km raster:
SO2, NO/NO2, CO, O3, benzene, toluene, xylenes, ethyl benzene, trichlorethene, tetrachlorethene, sedimenting particulate matter, components of sedimenting particulate matter (Pb, Cd, Tl, As), airborne particles, components of airborne particles (Pb, Cd, As, Ni), soot, asbestos, BaP.

| |

|
 |
|
| © City of Stuttgart, Office for Environmental Protection, Section of Urban Climatology |