| Friday, 04/19/2024 | ||
| Friday, 04/19/2024 | ||
| Current meteorological data | |
| Air temperature: | 41.54 (°F) |
| 5.3 (°C) | |
| Wind speed: | 10 (km/h) |
| Wind direction: | S-W, 221.4 ° |
| Global radiation: | -- (W/m²) |
| Act. UV-Index: | 0 |
| Precipitation: | 0.0 (ltr/m²) |
| (Updated: 04/19/2024, 05:00, S-Mitte, Amt für Umweltschutz |
|
| More meteorological data | |
| More about weather Stuttgart |
|
| Current sun location |
|
| Webcams in Stuttgart |
|
Weather forecast Stuttgart  |
|
| Weather forecast Europe |
|
| Weather radar Germany |
|
| More links | |
| News and current events |
|
| Current number of summer days and hot days in Stuttgart 2024 | |
| Current graphics | |
| News about the Stuttgart noise action plan, update 2025 and Tempo-30 reports (German) | |
| Update 2025 | |
| Climate Center Stuttgart | |
| Climate Dashboard Stuttgart | |
| Summer Days and Hot Days in Stuttgart (until 2023) | |
| Air: Press releases (German) | |
| UV-Index Prognosis (BfS) | |
| Urban climate Viewer: Maps and plans with detailed thematic maps on climate, air and noise | |
| Noise Maps Stuttgart 2022 | |
| Noise action plan Stuttgart | |
| Clean air plan Stuttgart | |
| NO2 and PM10 exceedances | |
| Current measurements from the stations (LUBW) | |
| Picture gallery More news | |
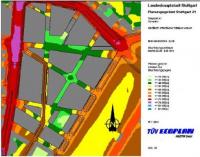 | 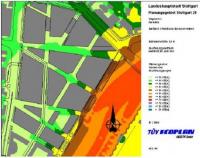 | |
Fig. 8-1: Noise immission plan Road traffic, current state Plan area A1 during the night |
Fig. 8-2: Noise immission plan Railway traffic, current state Plan area A1 during the night |
|

| |
|
| © City of Stuttgart, Office for Environmental Protection, Section of Urban Climatology | |

